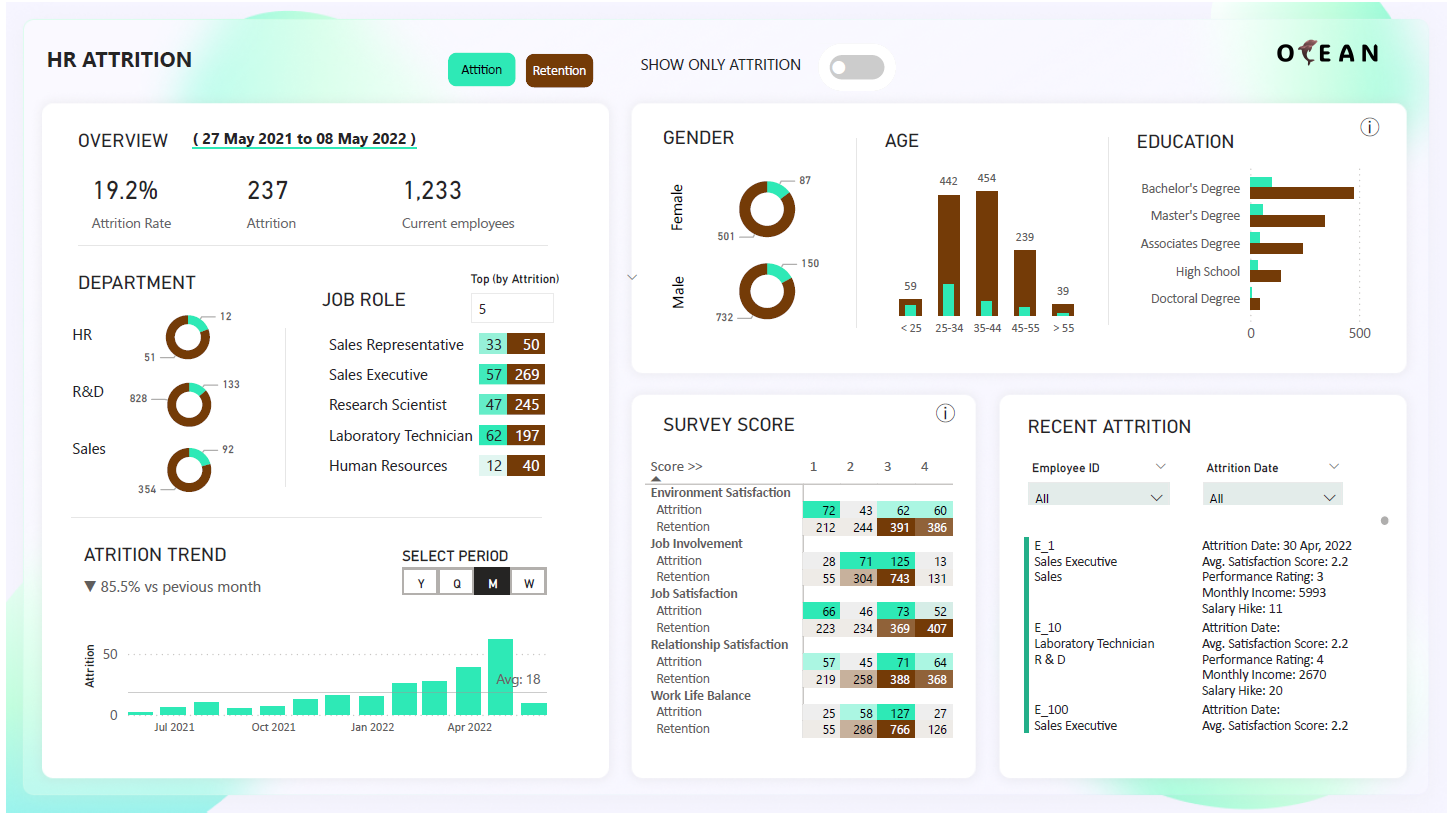
The main objective was to create a business-style dashboard that would assist the HR team to:
Identify the factors contributing to attrition in the company
Monitor current drivers of attrition and prevent new ones from emerging
Identify the KPIs that should be tracked to address attrition at the organisation level
Fruit Well company quests for a signature stylish dashboard that give them insights into diversity of humance resources and to look up employee information, as well as being able to narrow down to specific department, country and date period. With the use of various advanced data tranformation, modelling, DAX, and visualisation techniques, the dashboard allows users easily customise and grab infomation to drive decision such as which age, gender, education needs more hires, which countries are too dominant and their total percentage, together with a swift lookup for individual employee details, including their image. On top of that, users can personalise preference between dark/light mode to support their vision need.
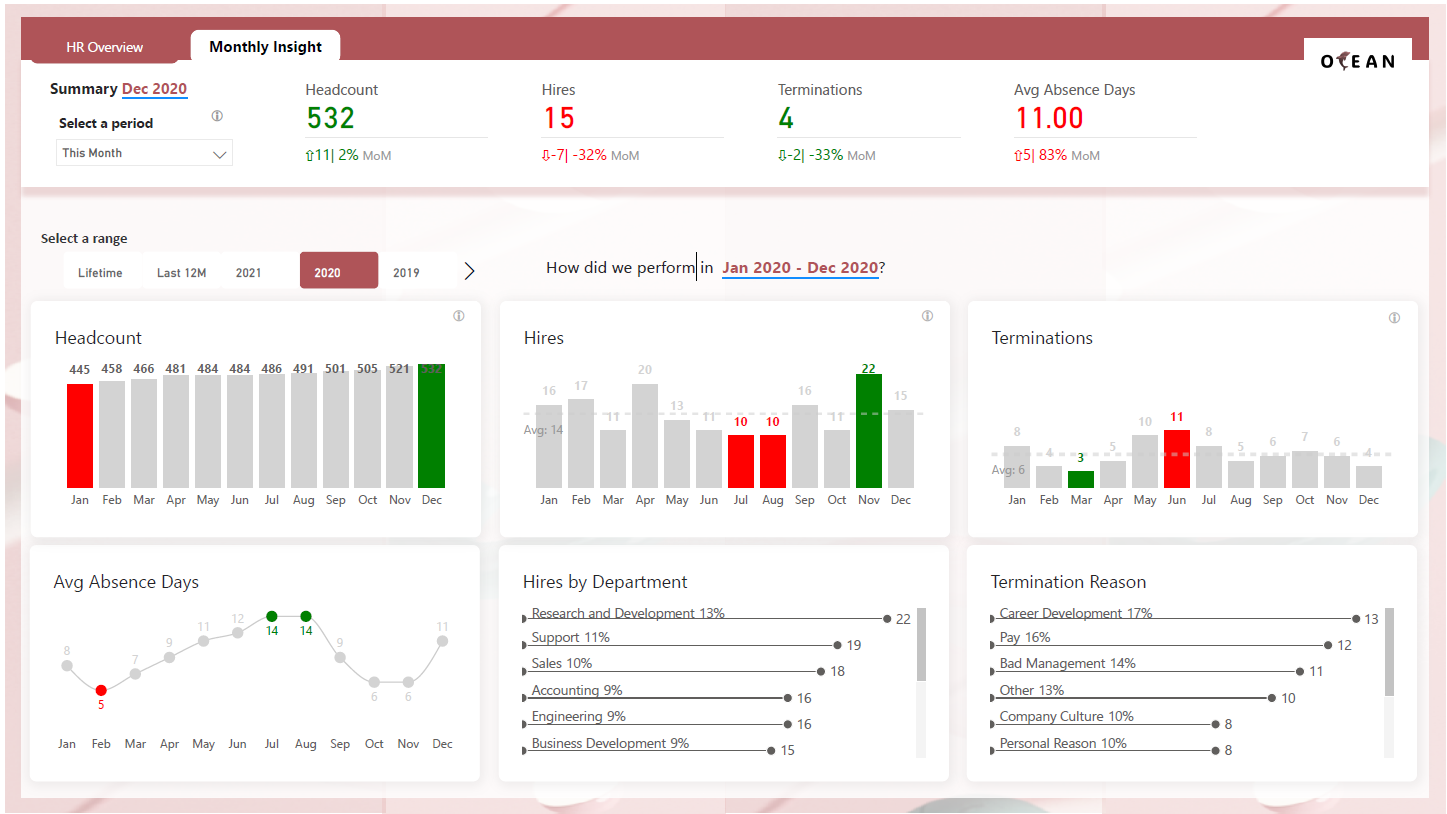
This dashboard is highly interactive, and comprises of two views. The first tab is HR Overview provides users with insight into historical trend. The second tab is analysis of HR stats monthly. Both views allow users to dynamically switch and customise period and category to analysise data, expand insight by hovering over info icon or data point .
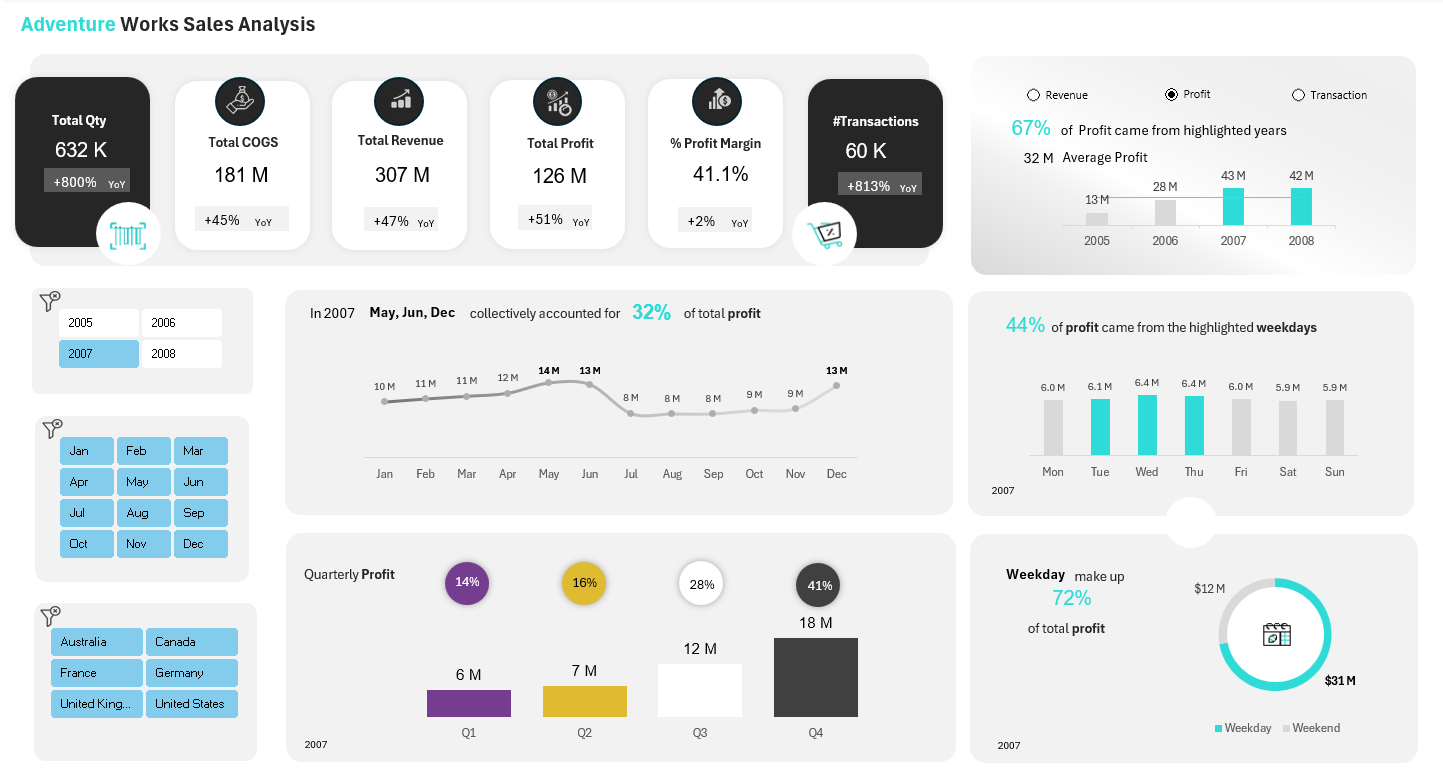
Excel is a powerful tool for analyst, while saving huge cost. As part of Excel, Power Pivot data model can handle a staggering amount of data of around 2 billions rows, table, columns, Power Query can support everything with ETL. In this project, the main objective is to analyse profit, assess performance over time and across customer geography, as well as identifying pattern and trend. The dashboard is highly dynamic and tells a story, allows users to switch between profit, revenue, transaction over years, identify top 3 months, weekdays by profit, slice and dice across year, month, client country in a click. The second tab deep dives into products, targeting audiences that drive profit.
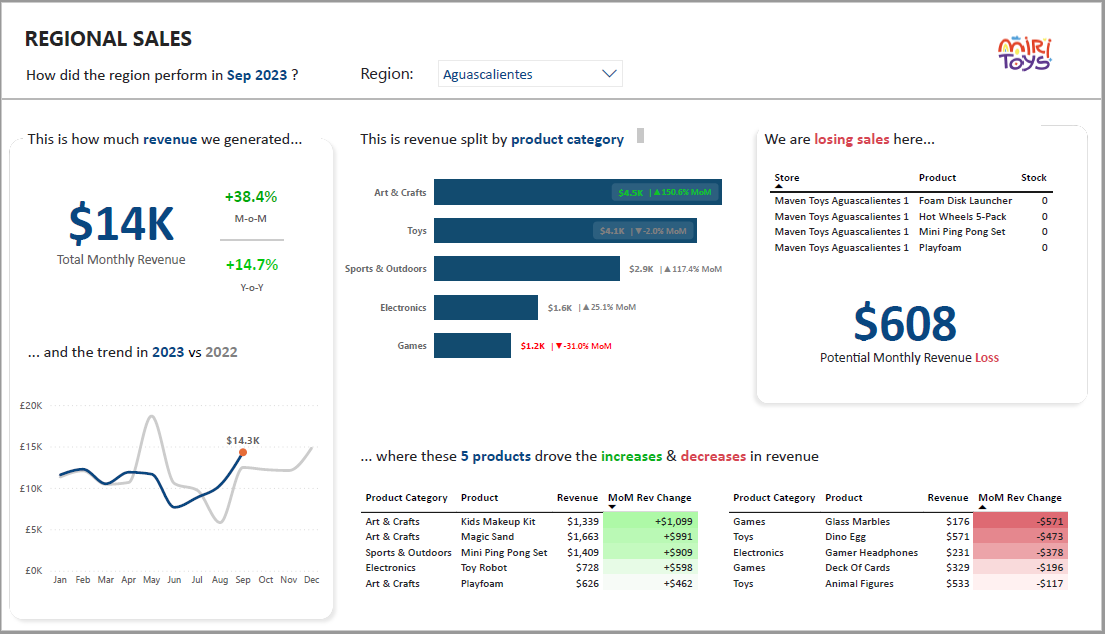
This dashboard provides an overview of monthly regional sales growth, analyses sales by product to identify driver for profit/loss, as well as potential revenue loss due to out of stock inventories. From that manager could strategise on product range and stock management to foster sales. With the power of story telling and right metrics, the dashboard has successfully served the key objectives and help users capture essential information.
As part of business intelligence solution, the project's aim is to build a data warehouse, datamart/ database model for sales in sql server, with utilisation of SSIS for ETL pipelines, SQL job agent for data refresh scheduling.
As part of BI project, this section will provide insights into customers and their purchasing activities online in T-SQL, supporting sales and marketing team in business process or strategy.
A SQL project to conduct importing, shaping data before implementing a exploratory analysis to answer complex questions and draw interesting insight, with the combination of comprehensive and advanced techniques, including window functions, multi ctes, subqueries, as well as dynamic procedure, recursive, cursor for automation with job agent.
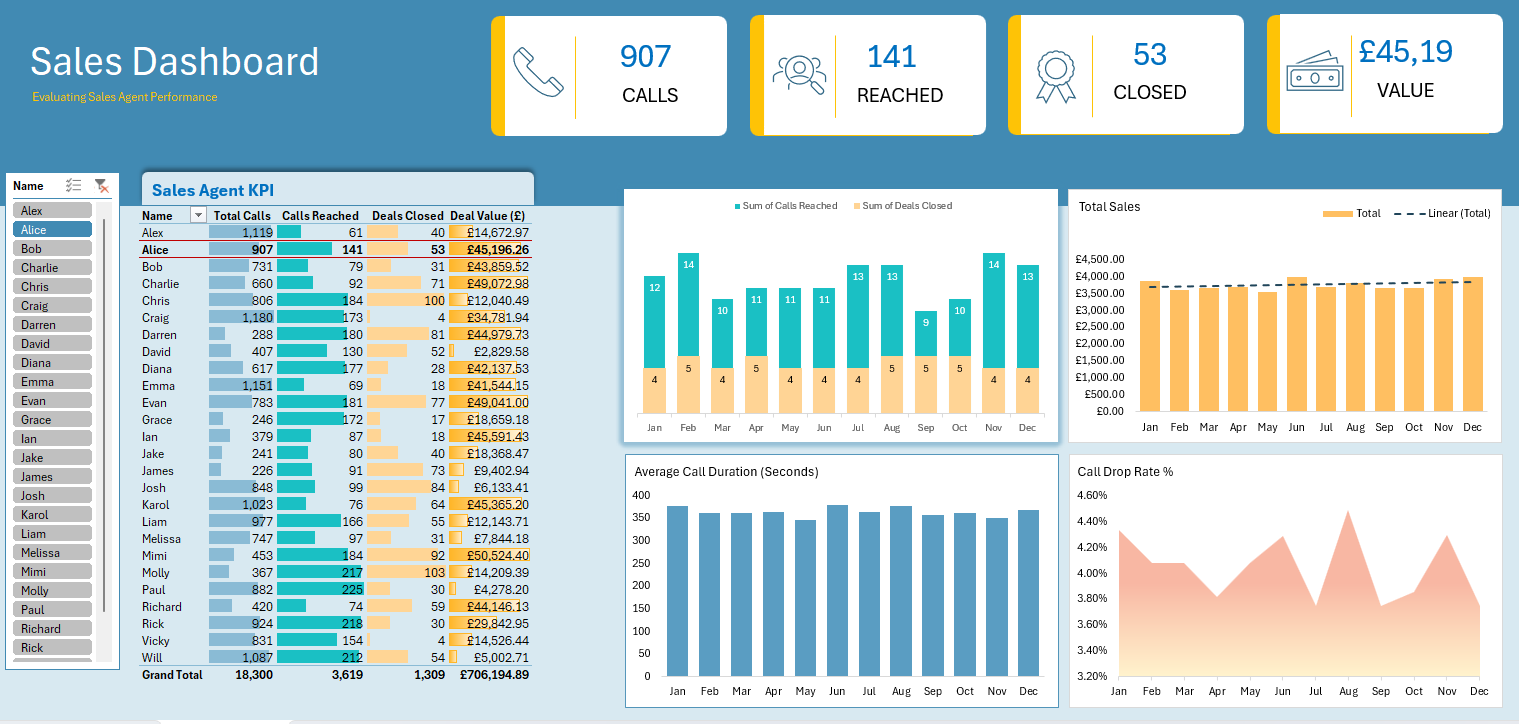
This is an interactive Excel dashboard that analyses sales agent performance.

This Power BI dashboard gives users an overview of sales and tracks against target.
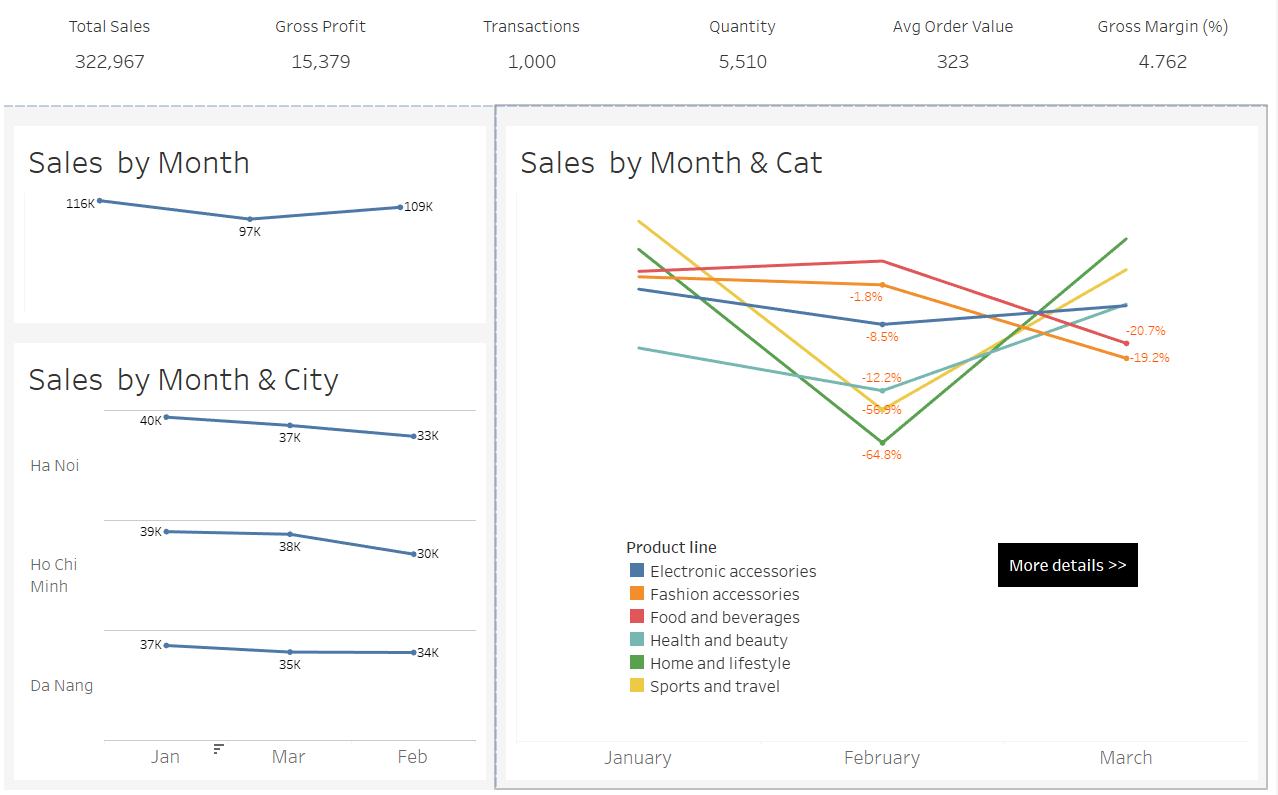
This Tableau dashboard provides a deep dive into trend of sales by month, city and product category.
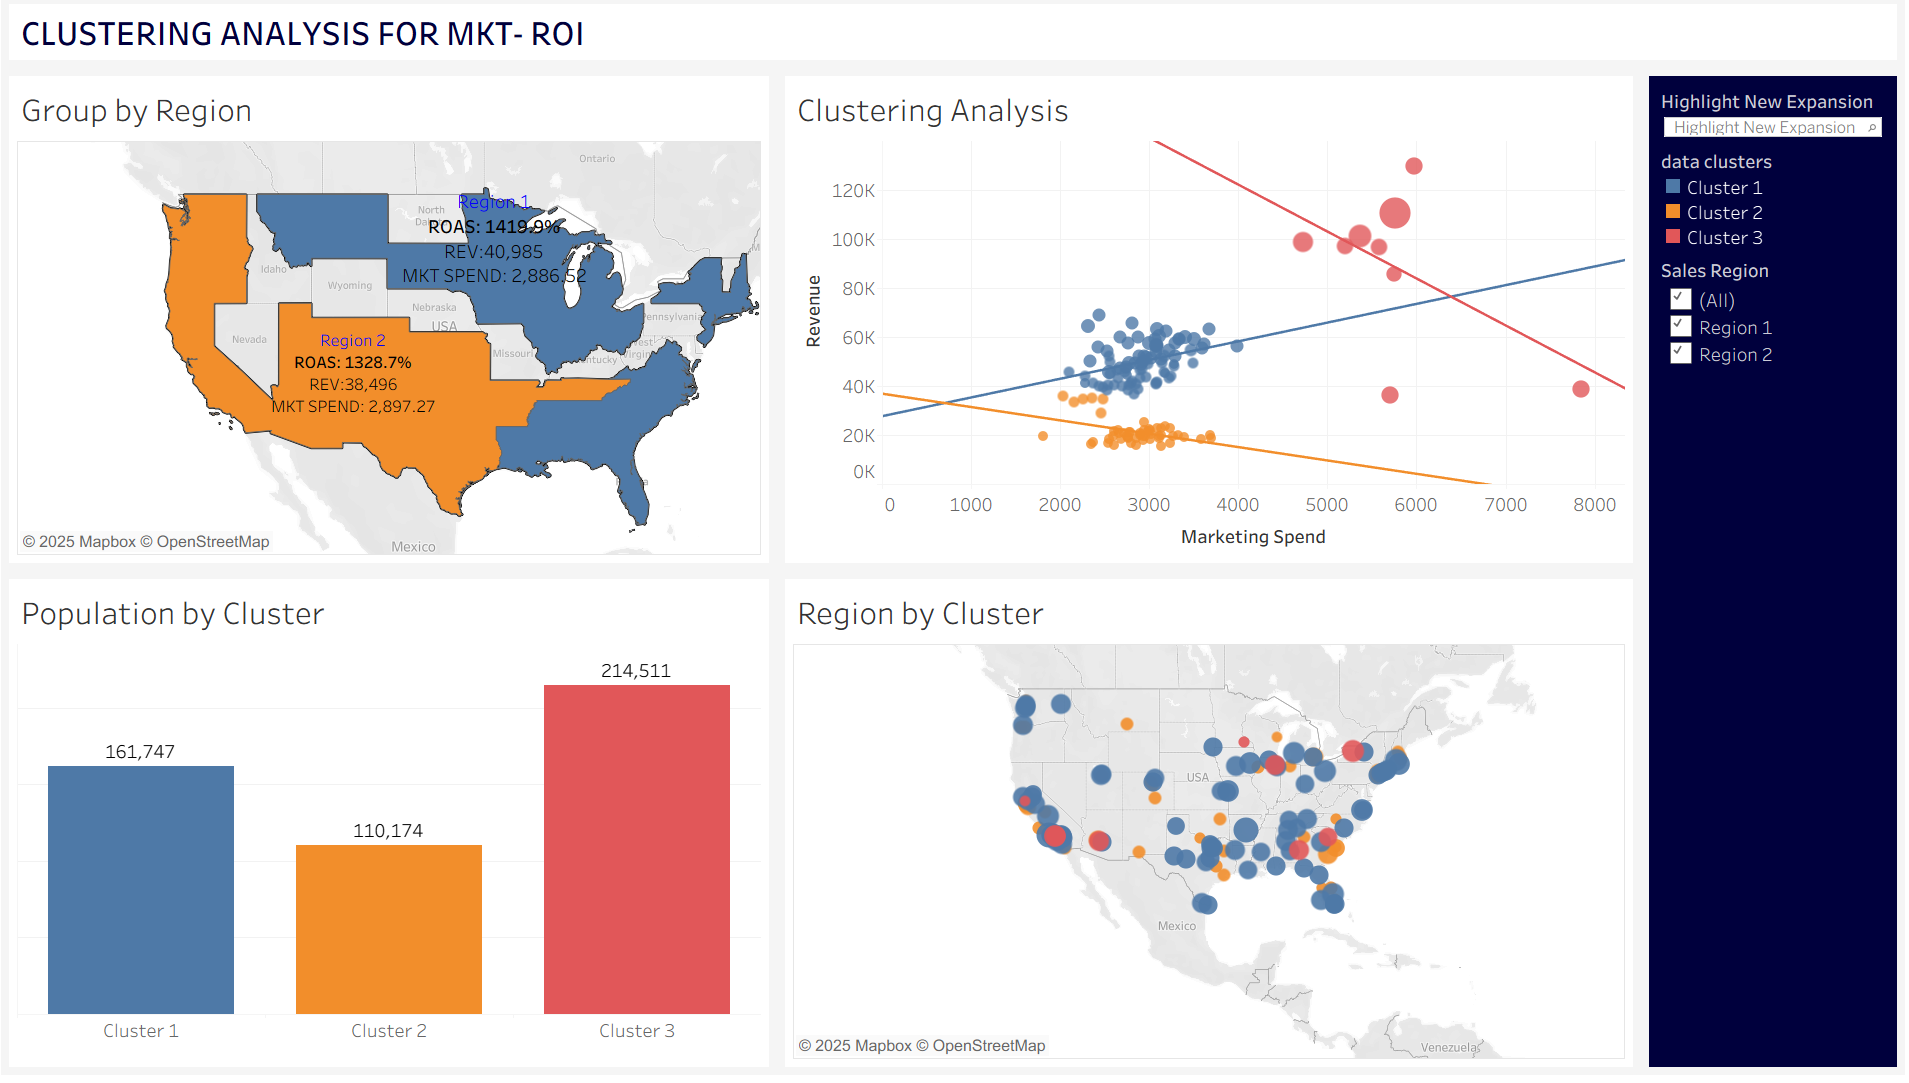
This project usetilises tableau to conduct K-means clustering and linear regression (based on Revenue, MKT Spend, Population) to draw insights into return on Marketing spend accross region, stores, as well as support investment plan of a laundry service business.
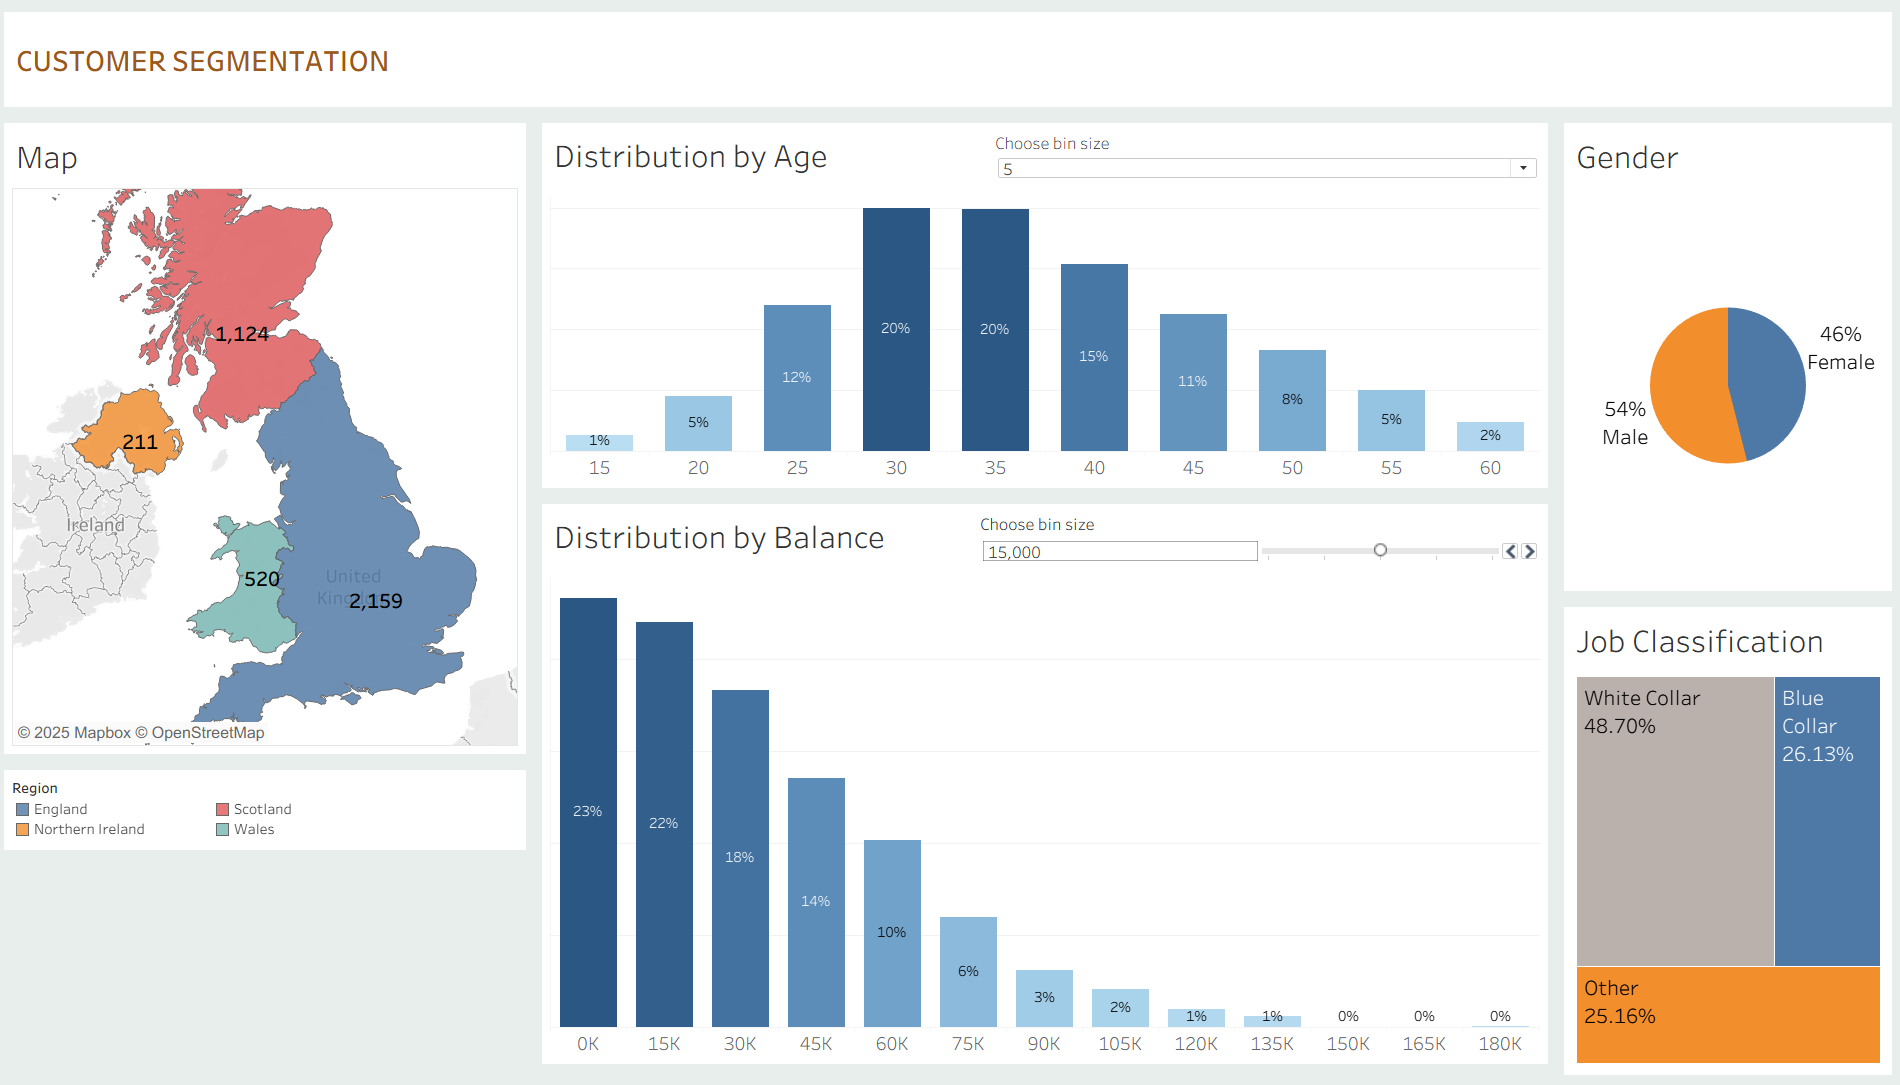
The project is to conduct a customer segmentation analysis of banking customers.
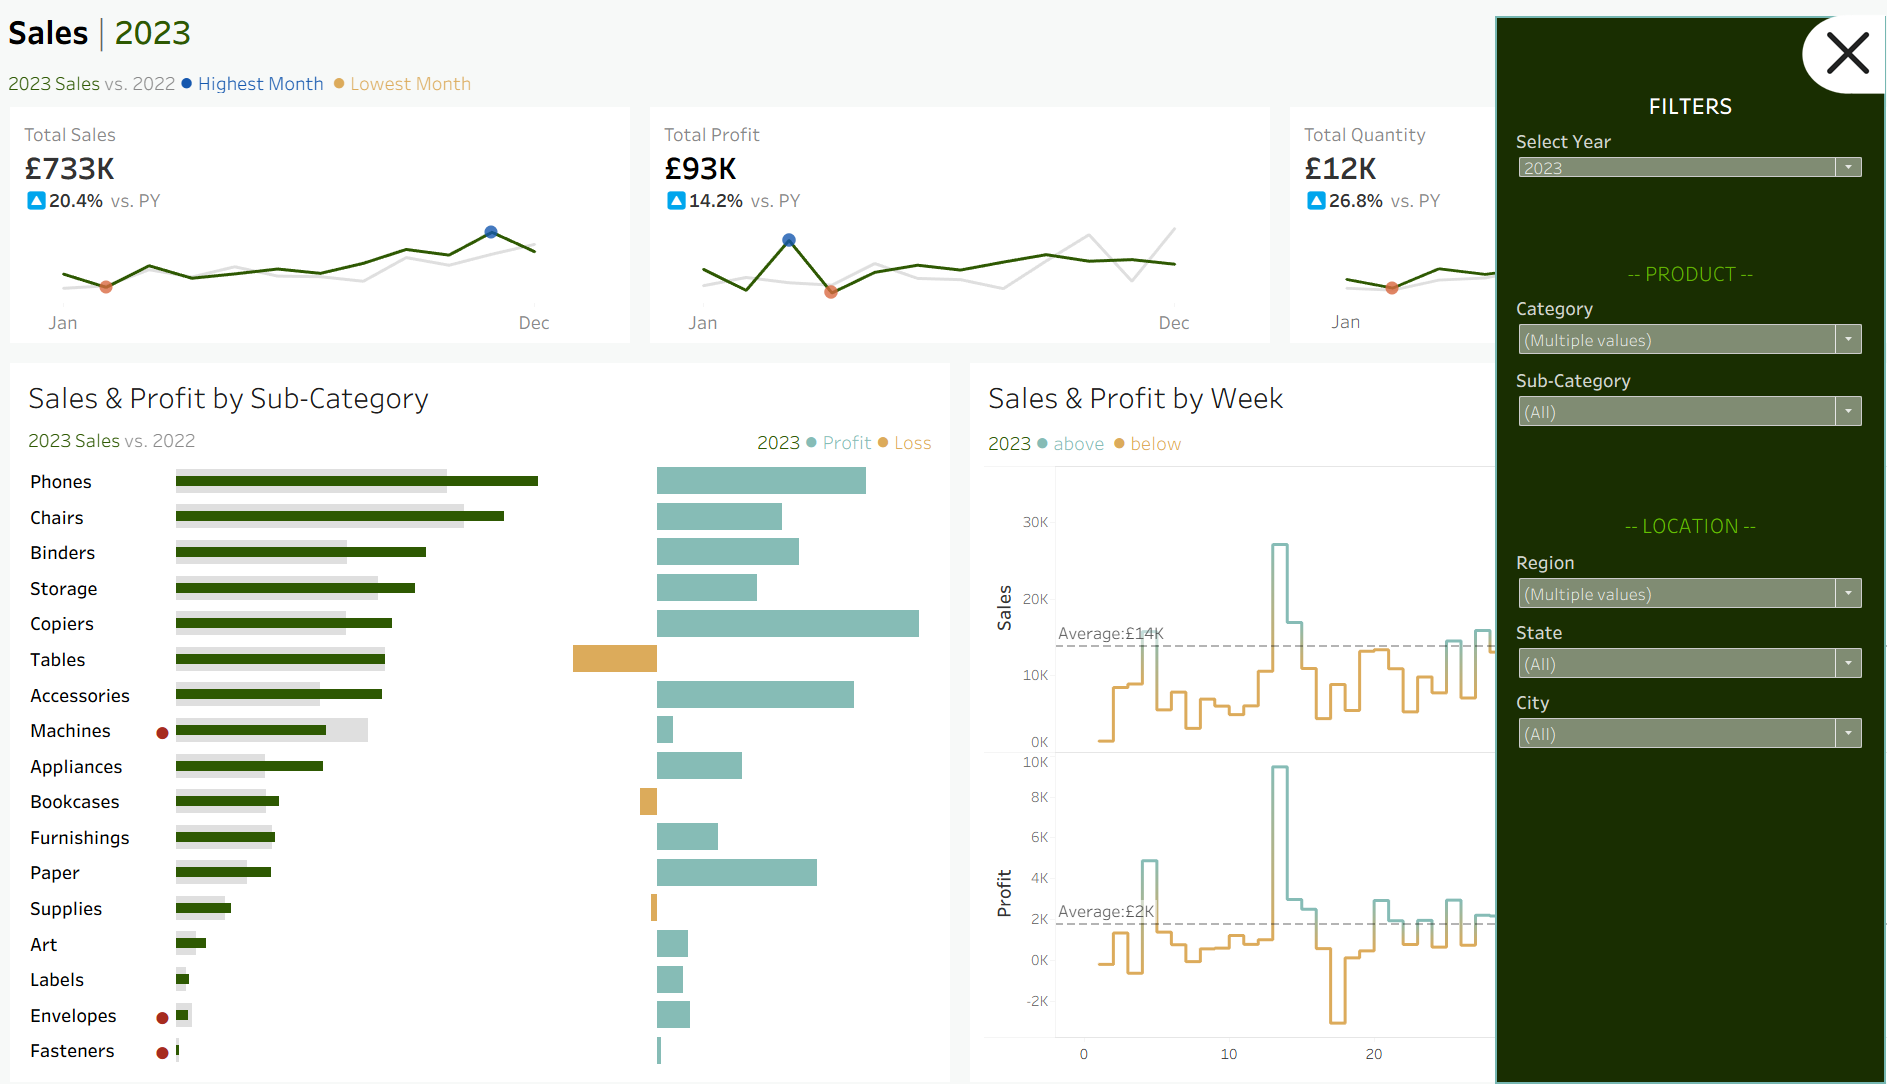
This Tableau dashboard presents an overview of the sales metrics and trends in order to analyse performance and sales trend.
This project is about data of customers who buys clothes online. The store offers in-store style and clothing advice sessions. Customers come in to the store, have sessions/meetings with a personal stylist, then they can go home and order either on a mobile app or website for the clothes they want. The company is trying to decide whether to focus their efforts on their mobile app experience or their website.
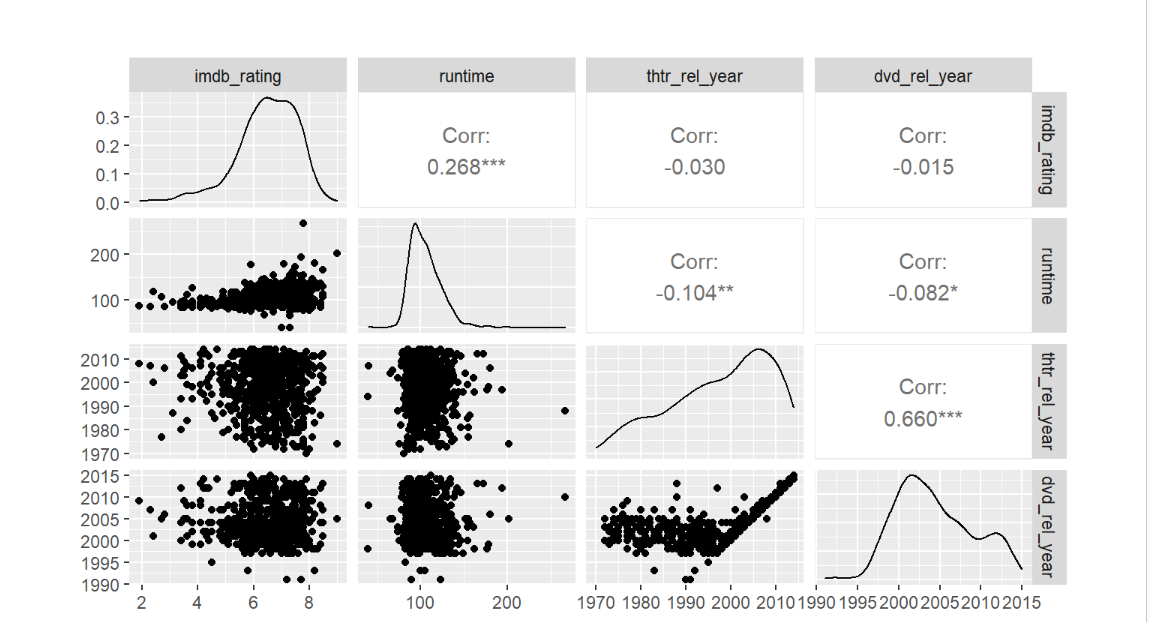
This project was to use linear regression modeling technique with the use of R to forecast rating of a movie.